|
|||||||||||||||
|
|
Code A function plotter in R: With the
statistical language R,
it is very easy to write a simple function plotter
in a few lines. Simply enter the following code in a
script window:
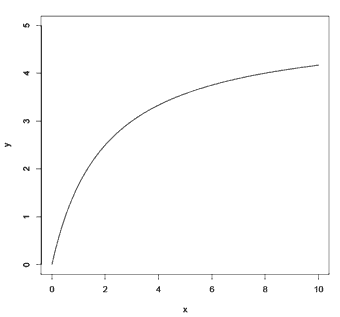
Then modify the settings, e. g. coordinates and of course the function (the second argument of the "lines" function in the last line) as desired and execute the script. In the example, a Michaelis-Menten function with maximal output G (e. g. velocity or receptor density) and dissociation constant D is drawn. The result will be as follows:
|
||||||||||||||
|
|
|
||||||||||||||
|
|
|||||||||||||||
Imprint and legal information | Privacy policy | Last revision: Fri, Jun 1, 2018
