Scientific Software and Services for Systems Biology and Medical Cybernetics 

 MAIN MENU

 Welcome

 Software

 Services

 Contact


 CONTACT

Dr. Johannes W. Dietrich

D-44797 Bochum,
Nordrhein-Westfalen
F. R. Germany
j.w.dietrich@[Host]

For [Host] please substitute "formatio-reticularis.de" or "medical-cybernetics.de"

Userguide for ROC.KIT:


Please keep i n mind that ROC.KIT is intended for the evaluation of continuous data like laboratory results. Categorial data are best investigated with applications like ROCKIT from the Kurt Rossmann Laboratories for radiologic image research, University of Chicago.


1.

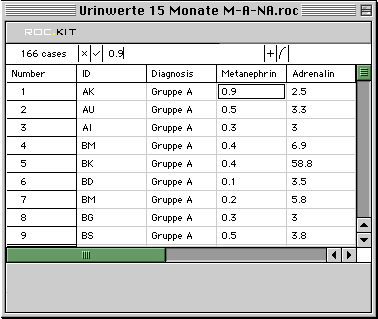
Create your dataset. You may do this from within ROC.KIT's data table window or you can import tab-delimited data that have been entered in a spreadsheet or database application.

Generally, Patients or probands are organized in rows, data in columns. The first column is reserved for a patient's ID and the second one for the diagnosis or group code. The remaining columns may be used for parameters to be evaluated.

In files to be imported the layout is similar. The first column (or the data before the first tab position) should contain an ID for the patient or proband (e. g. a number code), the second column the diagnosis. Again, remaining columns may be used for parameters to be evaluated. Import data with the menu point "Import..." of the file menu in ROC.KIT.

ROC.KIT's data table may be used in many respects like a apreadsheet window.


2.

Start evaulation by choosing the menu point "Create ROC curve" from the analysis menu or by clicking the ROC-curve icon in the data table:

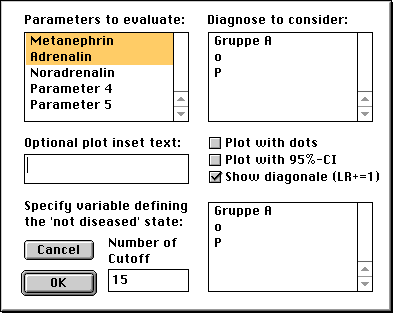
ROC.KIT will read the data and ask you for the parameters and the diagnose to evaluate. It is necessary to select a diagnose and at least one parameter and to specify a diagnosis as "not diseased" or "normal".

You may enter an inset text for the plot. Click the appropriate checkboxes for plotting with dots, confidence intervals or a diagonale for likelihood ratio of 1.


3.

Click "OK" in order to confirm your choice. ROC.KIT will then calculate ROC-curves for the specified parameters.


4.

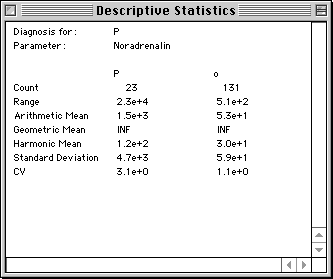
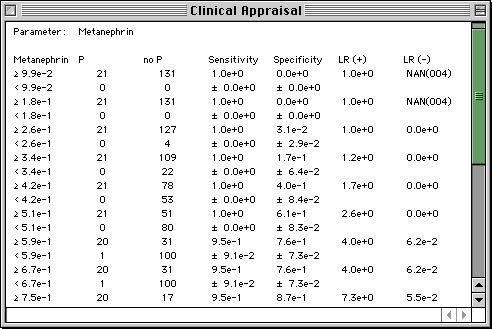
Additional data are displayed in windows for descriptive statistics and detailled results:


Data and curves may be copied, safed or exported.

To the main ROC.KIT page.

Important Hints

Interconnect


SourceForge.net Logo  

Open Source Initiative


© 1999-2005 J. W. D.